Largest oil exporters. Oil reserves, production and consumption by countries of the world. How many years will oil reserves last?
The world's total proven oil reserves (as of 2015) amount to 1,657.4 billion barrels. The largest oil reserves - 18.0% of all world reserves - are located in Venezuela. The proven oil reserves in this country are 298.4 billion barrels. Saudi Arabia is the second largest oil reserves country in the world. Its proved reserves amount to about 268.3 billion barrels of oil (16.2% of the world's total). Proved oil reserves in Russia account for approximately 4.8% of the world - about 80.0 billion barrels, in the United States - 36.52 billion barrels (2.2% of the world's total).
Oil reserves in the countries of the world (as of 2015), barrels
Oil production and consumption by country
The world leader in oil production is Russia - 10.11 million barrels per day, followed by Saudi Arabia - 9.735 million barrels per day. The world leader in oil consumption is the United States - 19.0 million barrels per day, followed by China - 10.12 million barrels per day.
Oil production by countries of the world (as of 2015), barrels per day
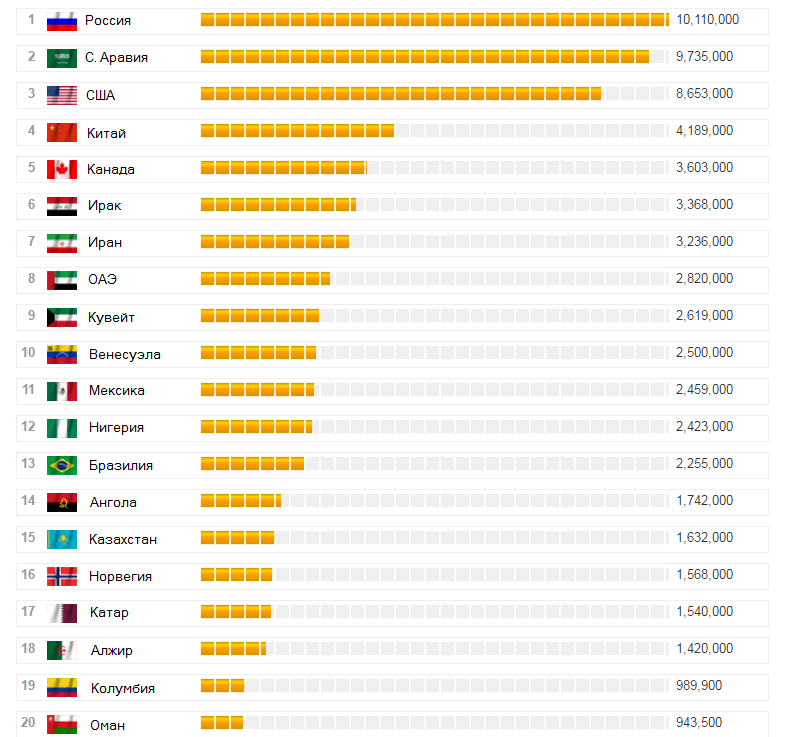
data http://www.globalfirepower.com/
Oil consumption by countries of the world (as of 2015), barrels per day
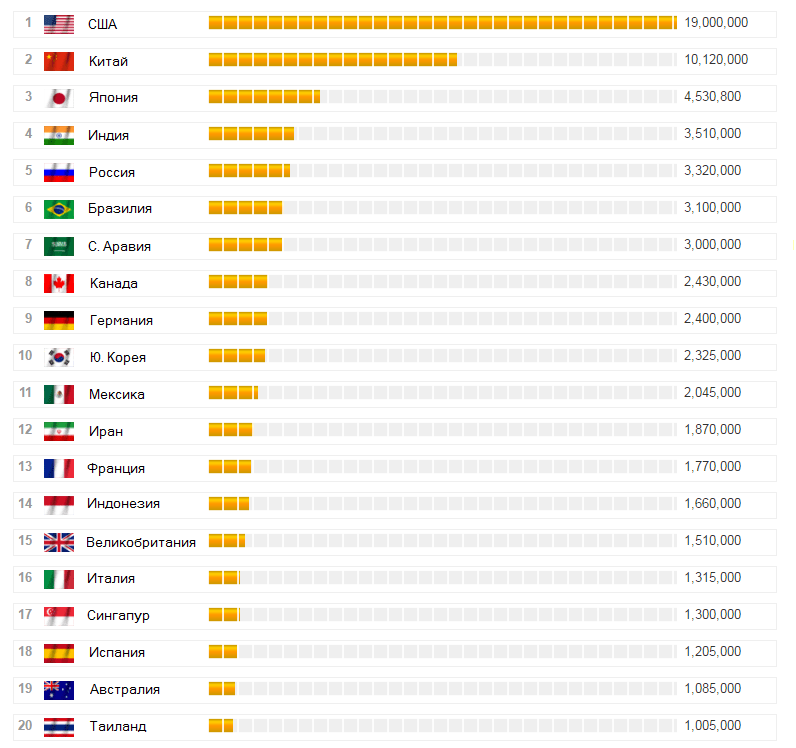
data http://www.globalfirepower.com/
Experts from the International Energy Agency (IEA) expect global oil demand to grow by 1.4 million barrels per day in 2016 to 96.1 million barrels per day. In 2017, according to forecasts, global demand will reach 97.4 million barrels per day.
World oil exports and imports
The leaders in oil imports are currently the United States - 7.4 million barrels per day and China - about 6.7 million barrels per day. The export leaders are Saudi Arabia - 7.2 million barrels per day and Russia - 4.9 million barrels per day.
Export volume by countries of the world in 2015
| a place | country | export volume, bbl / day | change,% to 2014 |
| 1 | Saudi Arabia | 7163,3 | 1,1 |
| 2 | Russia | 4897,5 | 9,1 |
| 3 | Iraq | 3004,9 | 19,5 |
| 4 | UAE | 2441,5 | -2,2 |
| 5 | Canada | 2296,7 | 0,9 |
| 6 | Nigeria | 2114,0 | -0,3 |
| 7 | Venezuela | 1974,0 | 0,5 |
| 8 | Kuwait | 1963,8 | -1,6 |
| 9 | Angola | 1710,9 | 6,4 |
| 10 | Mexico | 1247,1 | 2,2 |
| 11 | Norway | 1234,7 | 2,6 |
| 12 | Iran | 1081,1 | -2,5 |
| 13 | Oman | 788,0 | -2,0 |
| 14 | Colombia | 736,1 | 2,0 |
| 15 | Algeria | 642,2 | 3,1 |
| 16 | Great Britain | 594,7 | 4,2 |
| 17 | USA | 458,0 | 30,5 |
| 18 | Ecuador | 432,9 | 2,5 |
| 19 | Malaysia | 365,5 | 31,3 |
| 20 | Indonesia | 315,1 | 23,1 |
oPEC data
Import volume by countries of the world in 2015
| a place | country | import volume, bbl / day | change,% to 2014 |
| 1 | USA | 7351,0 | 0,1 |
| 2 | China | 6730,9 | 9,0 |
| 3 | India | 3935,5 | 3,8 |
| 4 | Japan | 3375,3 | -2,0 |
| 5 | South Korea | 2781,1 | 12,3 |
| 6 | Germany | 1846,5 | 2,2 |
| 7 | Spain | 1306,0 | 9,6 |
| 8 | Italy | 1261,6 | 16,2 |
| 9 | Fratia | 1145,8 | 6,4 |
| 10 | Netherlands | 1056,5 | 10,4 |
| 11 | Thailand | 874,0 | 8,5 |
| 12 | Great Britain | 856,2 | -8,9 |
| 13 | Singapore | 804,8 | 2,6 |
| 14 | Belgium | 647,9 | -0,3 |
| 15 | Canada | 578,3 | 2,6 |
| 16 | Turkey | 505,9 | 43,3 |
| 17 | Greece | 445,7 | 6,0 |
| 18 | Sweden | 406,2 | 7,5 |
| 19 | Indonesia | 374,4 | -2,3 |
| 20 | Australia | 317,6 | -28,0 |
oPEC data
How many years will oil reserves last?
Oil is a non-renewable resource. Proved oil reserves (for 2015) amount to approximately 224 billion tons (1,657.4 billion barrels), estimated at 40-200 billion tons (300-1500 billion barrels).
By the beginning of 1973, the world's proven oil reserves were estimated at 77 billion tons (570 billion barrels). Thus, in the past, proven reserves have grown (oil consumption is also growing - over the past 40 years, it has grown from 20.0 to 32.4 billion barrels per year). However, since 1984, the annual volume of world oil production has exceeded the volume of explored oil reserves.
World oil production in 2015 was about 4.4 billion tons per year, or 32.7 billion barrels per year. Thus, at the current rate of consumption, proven oil reserves will last for about 50 years, and estimated reserves for another 10-50 years.
US oil market
As of 2015, the United States imported approximately 39% of its total oil consumption and produced 61% on its own. The main oil exporters to the United States are Saudi Arabia, Venezuela, Mexico, Nigeria, Iraq, Norway, Angola and the United Kingdom. Roughly 30% of US oil imports and 15% of total US oil consumption is oil of Arab origin.
According to experts, strategic oil reserves in the United States currently amount to more than 695 million barrels, and commercial oil reserves are about 520 million barrels. For comparison, Japan's strategic oil reserves are about 300 million barrels, and in Germany - about 200 million barrels.
Oil production in the United States from unconventional sources in 2008-2012 increased approximately fivefold, amounting to almost 2.0 million barrels per day by the end of 2012. By the beginning of 2016, the 7 largest shale oil basins were already producing about 5.0 million barrels daily. The average share of shale oil, or as it is often called, light oil from tight reservoirs, in total oil production in 2016 was 36% (up from 16% in 2012).
Production of conventional crude oil in the United States (including condensate) was 8.6 million bbl / d in 2015, which is 1.0 million bbl / d less than in 2012. The total volume of oil production in the United States, including shale oil, in 2015 amounted to more than 13.5 million barrels per day. Much of the gain in recent years has been driven by increased oil production in North Dakota, Texas and New Mexico, where fracturing and horizontal drilling technologies have been used to produce oil from shale formations.
In percentage terms (an increase of 16.2% over the previous year), 2014 was the best year in more than six decades. Annual increases in oil production regularly exceeded 15% in the first half of the 20th century, but these changes were smaller in absolute terms because production levels were significantly lower than they are now. US oil production has grown in each of the previous six years. This trend followed the period from 1985 to 2008, in which oil production fell every year (except for one year). In 2015, the growth of oil production in the United States stalled due to a sharp drop in oil prices in the second half of 2014.
According to the latest IEA estimates, conventional oil production in the United States in 2016 will be 8.61 million barrels per day, in 2017 - 8.2 million barrels per day. US oil demand in 2016 will average 19.6 million barrels per day. The forecast for the average oil price for 2016 has been raised to $ 43.57 per barrel, and for 2017 - to $ 52.15 per barrel.
This is stated in a press release from BP, dedicated to the publication of the company's annual statistical review. Last year, Russia produced 540.7 million tons of oil and condensate. Export went to 254.7 million tons of crude oil and 150.1 million tons of petroleum products, explained a company representative. In total, this figure is higher than that of Saudi Arabia, he added. Data on the export of oil and petroleum products from Saudi Arabia are not disclosed in the report. The BP representative did not do this either. But the report says that oil production in the country rose to a record 568.5 million tons, while domestic consumption amounted to 168.1 million tons.The difference, it turns out, amounted to 400.4 million tons.
Exports from Russia increased due to an increase in liquid hydrocarbon production while refining volumes decreased, explains Daria Kozlova, a Vygon Consulting consultant. Production was influenced by tax incentives for new fields in a number of regions and a favorable pricing environment, said Denis Borisov, director of the Moscow oil and gas center EY. According to him, 2015 was the first year in more than 10 years when refining in Russia declined. First of all, this is due to the decrease in customs subsidies due to the fall in oil prices, Kozlova continues. It is more profitable for companies to export crude oil than to process it. At the same time, the main export oil product in Russia is fuel oil, which is cheaper than crude oil, says Borisov.
The Ministry of Energy explains the growth in exports by the same factors. Domestic oil consumption in Russia fell by 5.2% due to the economic downturn, BP said.
The largest increase in imports in the world last year was provided by Europe (bought 488.1 million tons of oil and 184 million tons of oil products) and China (335.8 million and 69.5 million tons). Russia remains the leading supplier of oil and gas to Europe, accounting for 37 and 35% of European consumption, according to BP. Europe last year received 158.5 million tons of oil and 88.9 million tons of oil products, China - 42.4 million and 3.8 million tons. Focus on Asia is the main trend for Russian exporters in the past few years, the share of supplies to the East is growing, says Alexander Kornilov, senior analyst at Aton. He calls Rosneft a pioneer here - it has long-term contracts with CNPC.
But Rosneft this year plans to increase oil supplies to European consumers via the Druzhba pipeline by 3-5% to about 28.7-29 million tons, said a company representative. “At the same time, the company is actively working with partners from the Asia-Pacific region: by the end of 2015, the volume of oil supplies in this direction increased by 18.5% compared to 2014 to 39.7 million tons,” he adds. Gazprom Neft last year exported 9.58 million tons of oil to the far abroad and 2.46 million tons to the CIS, a company representative said. Representatives of Lukoil and Surgutneftegaz did not respond to calls from Vedomosti, a representative of Bashneft was not available to journalists.
OPEC, Russia and other producers are in the midst of a concerted effort to forcefully rebalance the oil market, with prices rising to highs in two and a half years in recent weeks.
However, with continued strong oil exports dampening market sentiment, CNBC is looking at the world's top 10 oil exporters.
Oil production and its ancillary activities account for about 45 percent of Angola's gross domestic product (GDP) and about 95 percent of its exports.
Since joining OPEC in 2007, Angola has become the Cartel's sixth largest oil exporter.
9. Nigeria
Nigeria, the most populous country under OPEC, is Africa's largest oil exporter and producer.
8. Venezuela
In 2016, Venezuela, the founding member of the 14-member cartel, exported about 1.9 million barrels per day in 2016, according to OPEC data.
Although the South American country boasts the largest oil reserves in the world, it is currently in the midst of a full blown crisis. The ongoing turmoil was fueled by years of economic inactivity, and the recession was further contributed by a three-year decline in oil prices. Venezuela has experienced food shortages, severe inflation and violent street clashes as President Nicolas Maduro prioritizes international loan repayments.
Oil revenues account for about 95 percent of the country's export earnings.
President Donald Trump has threatened to end the international nuclear treaty with Iran, and if the U.S. Congress agrees, Tehran could receive new sanctions, affecting the ability of international companies to do business in the oil-rich country.
OPEC estimates Kuwait exported more than 2.1 million barrels per day in 2016.
The oil and gas sector of an OPEC member country accounts for about 60 percent of the country's GDP, as well as 95 percent of export revenues.
5. United Arab Emirates
According to OPEC data, the United Arab Emirates exported nearly 2.5 million barrels per day in 2016.
About 40 percent of the country's GDP is directly dependent on oil and gas production. The country, which consists of seven emirates along the Arabian Peninsula, joined OPEC in 1967.
Canada exports just over 3.2 million barrels per day, according to the most recent figures released by the World Factbook.
The non-OPEC country exported almost as much as the two top exporters in Africa. Canada has the third largest oil reserves in the world.
OPEC and Russian officials have called on some of the world's leading oil producers, both inside and outside the cartel, to form consensus and support a supply cap mechanism until the end of 2018.
And while Iraq is the second largest producer and exporter of oil in OPEC countries, Baghdad has not yet reduced production to the level it agreed last winter.
Iraq exported 3.8 million barrels per day in 2016, according to figures released by OPEC.
2. Russia
Moscow and OPEC are looking to cut oil production to clear up global supply surplus from January. The goal is to reduce global oil reserves and drain the surplus that has driven prices down over the past three years.
1. Saudi Arabia
Saudi Arabia is the world's leading exporter and second largest oil producer. According to data published on the cartel's website, the OPEC leader exported 7.5 million barrels per day in 2016.
The Kingdom's successor to the throne ordered the arrest of powerful royal princes and businessmen in early November in what officials called anti-corruption.
Some believe the extraordinary purge is an attempt by Mohammed bin Salman to consolidate his power by eliminating potential rivals. And it could mean political uncertainty, tensions and possibly unrest not seen before in the history of the largest oil producer, OPEC.
1. Saudi Arabia
Saudi Arabia is the world's leading exporter and second largest oil producer. The country exported 7.5 million barrels per day in 2016, according to data published on the cartel's website.
On November 5, 2017, 11 high-ranking officials, including ministers and members of the royal family, were ousted and arrested in Saudi Arabia. Most of them are charged with bribery, money laundering and other abuses. Among them is the billionaire Al-Walid bin Talal.
Some experts believe the extraordinary purge is an attempt by the king's heir, Prince Mohammed bin Salman, to consolidate his power by eliminating potential rivals. And this could lead to political uncertainty, tensions and possible unrest, which the history of the largest oil producer has never known.
Russia - the world's largest oil exporter, not part of the OPEC cartel, exported more than 5 million barrels of oil per day in 2016 - the country increased oil exports year-on-year by 4.8% - to 253.9 million tons, follows from the Central dispatch control (CDU) TEK.
According to OPEC forecasts, the next five years, the demand for oil in the world will grow by 5 million barrels per day, and by 2040 - by 14.7 million barrels per day, primarily due to developing countries. But in Russia, a gradual reduction in oil production is expected due to the depletion of old fields and US sanctions, which prohibit the supply of technologies for shale production and projects in the Arctic.
In the long term, oil production in Russia, according to OPEC forecasts, will decrease to 11.2 million barrels per day in 2025 and to 11.1 million barrels per day in 2030 and will remain at this level in 2035 and 2040. As a result, Russia will cede the world leadership in oil production to the United States, and the share of Russian oil in world consumption will decrease from 11.4% in 2017 to 9.9% in 2040.
Although Iraq is the second largest producer and exporter of oil among OPEC members, Baghdad has not yet reduced production to the level it agreed to last winter. The country exported 3.8 million barrels a day in 2016, according to figures released by OPEC.
Canada has the third largest oil reserves in the world, according to the latest figures published by the World Factbook, Canada exports just over 3.2 million barrels per day. The non-cartel country exports almost as much as the two top exporters in Africa. Canada could significantly hinder the rebalancing of the oil market. According to Kevin Byrne from IHS Markit, in the coming years only the United States will overtake Canada in terms of production growth.
The Canadian Association of Petroleum Producers (CAPP) predicts that oil production will grow by 270,000 barrels per day in 2017 and another 320,000 barrels in 2018. In total, this is almost a third of all volumes that OPEC and other large producers have agreed to withdraw from the market.
According to OPEC data, in 2016, the United Arab Emirates exported almost 2.5 million barrels per day in 2016. About 40% of the country's GDP is directly dependent on oil and gas production. The UAE joined OPEC in 1967.
OPEC estimates Kuwait exported more than 2.1 million barrels per day in 2016. Kuwait's oil and gas sector accounts for about 60% of the country's GDP, as well as 95% of all export revenues.
In 2016, Iran exported nearly 2 million barrels per day, according to OPEC data. In October, US President Donald Trump adopted a new strategy for Iran. In it, Tehran is accused of interfering in conflicts in Syria, Yemen, Iraq, Afghanistan. Trump said Iran is not honoring the spirit of the 2015 nuclear deal and has threatened to change the terms of the Iranian nuclear deal if the US Congress approves. This would mark the renewal of US sanctions against Iran, affecting the ability of international companies to do business there.
8. Venezuela
In 2016, Venezuela, the founding country of the cartel, exported about 1.9 million barrels per day. Although Venezuela boasts the largest oil reserves in the world, the country is currently in the midst of a full-blown crisis.
The international rating agency S&P announced that Venezuela's rating has been downgraded to the default level. Venezuela has been plagued by food shortages, colossal inflation and street clashes. The ongoing turmoil was triggered by a multi-year economic crisis, exacerbated by a three-year slump in oil prices. Oil revenues account for approximately 95% of all the country's export earnings.
9. Nigeria
Nigeria is the most populous country in the OPEC cartel and the largest exporter and producer of oil in Africa. According to data released by OPEC, in 2016 the country was slightly ahead of Angola in oil exports - with a result of just over 1.7 million barrels per day.
10. Angola
Angola exported 1.7 million barrels per day in 2016, according to OPEC data. Oil production and related ancillary activities account for approximately 45% of Angola's GDP and approximately 95% of its exports. Since joining OPEC in 2007, Angola has become the cartel's sixth largest oil exporter.
The total actual need for net oil imports for all EU countries (28) amounted to 3.82 billion barrels (10.5 million barrels per day) in 2015. Energy deficit in oil and petroleum products is estimated at 86%. 100% is when absolutely all oil and oil products are imported.
Oil dependence is at historic highs.
Oil imports in 2015 compared to 2014 increased by 4.7% for all countries and by 5.9% for the top 10 importers, however, even 2 years of growth in oil imports (since 2013) does not compensate for the decline in imports since 2005. 
In 2015, oil imports are 9-10% lower than the peak levels of 2005-2006. The EU is a stagnant energy market. The demand is not growing there for three reasons: the economic recession since 2007, the increase in energy efficiency, the development of alternative energy sources. Over the next 10 years, oil imports in the EU 28 will decrease by at least another 10% in physical terms, mainly due to increased energy efficiency and trends towards alternative energy sources.
According to my calculations based on data and sources from the Euro Commission (EC), Russia in 2015 provided 30% of the total oil supplies, or about 3.1 million barrels. in a day. Superiority over the closest competitor (Norway) by 2.5 times. Average daily oil supplies of over 500 thousand barrels per day are provided by only 7 countries - Russia, Norway, Nigeria, Saudi Arabia, Iraq, Kazakhstan, Azerbaijan. All Middle East countries provide only 1.8 million barrels. per day or slightly less than 18% of the total supply. But entering the Iranian market in 2016 can provide at least 600 thousand barrels - this is exactly what was supplied to the EU (28) before the Iranian embargo. All African countries are about 2.6 million barrels. 
The table shows from which country and where the oil went in 2015 in million barrels per year according to my compilation of oil flows. We are talking exclusively about external oil supplies without further distribution within the EU, which is why there are less than 28 countries in the table, since not all support foreign trade energy ties.
This is in general terms. And what does the EU mean by the diversification of energy supplies (from where, where and how) is a separate conversation.
It might be helpful to read:
- Presentation "Strong and weak electrolytes" presentation of a lesson for an interactive whiteboard in chemistry (grade 9) on the topic Presentation on the use of electrolytes in medicine;
- Presentation on the topic: "Acids - as electrolytes" Presentation on the use of electrolytes in medicine;
- Presentation vladimir dal presentation for a reading lesson on the topic Literary presentation for grade 4;
- More about telephoto lenses;
- Creativity of Korney Ivanovich Chukovsky presentation for a reading lesson (grade 2) on the topic;
- Presentation on the topic "Biography of Paustovsky. Presentation on the topic of Paustovsky biography;
- Migratory and wintering birds presentation Migratory and wintering birds presentation for children;
- Traumatic brain injury Presentation on the topic of closed traumatic brain injury;